Basic diagnostics
Here you can find the list of basic diagnostic actions that may help you look for bug causes.
Engine#
This section describes Engine related diagnostic.
Engine health#
To check if the Engine Pods are in the Running state, run:
kubectl get pod -n capact-system -l app.kubernetes.io/name=engineAll the containers from Pods should be in the Running status. Restarts number higher than 1 may also indicate problems, e.g. not enough resource, lack of permissions, network timeouts etc.
Engine logs#
If the Engine is healthy, you should be able to track any bug by checking the logs. To check the logs, run:
kubectl logs -n capact-system -l app.kubernetes.io/name=engine -c engineTo check the logs since a given time, use the --since-time flag, for example:
--since-time=2020-03-30T10:02:08ZChecking Action status#
To check the Action status, run:
kubectl get actions.core.capact.io ${ACTION_NAME} -n {ACTION_NAMESPACE} -ojsonpath="{.status}"Checking Action status message#
To check the Action status message, run:
kubectl get actions.core.capact.io ${ACTION_NAME} -n {ACTION_NAMESPACE} -ojsonpath="{.status.message}"Checking rendered Action workflow#
To check the rendered Action workflow before execution, run:
kubectl get actions.core.capact.io ${ACTION_NAME} -n {ACTION_NAMESPACE} -ojsonpath='{.status.rendering.action.args.workflow}'NOTE: To display it in a more readable format, you can pipe it to jq.
Checking Action execution status#
An Action is executed via Argo Workflows. To check the execution status you can use either Argo CLI or Argo UI:
Using command line.
Install the latest stable Argo CLI for version v2.x.x, and run:
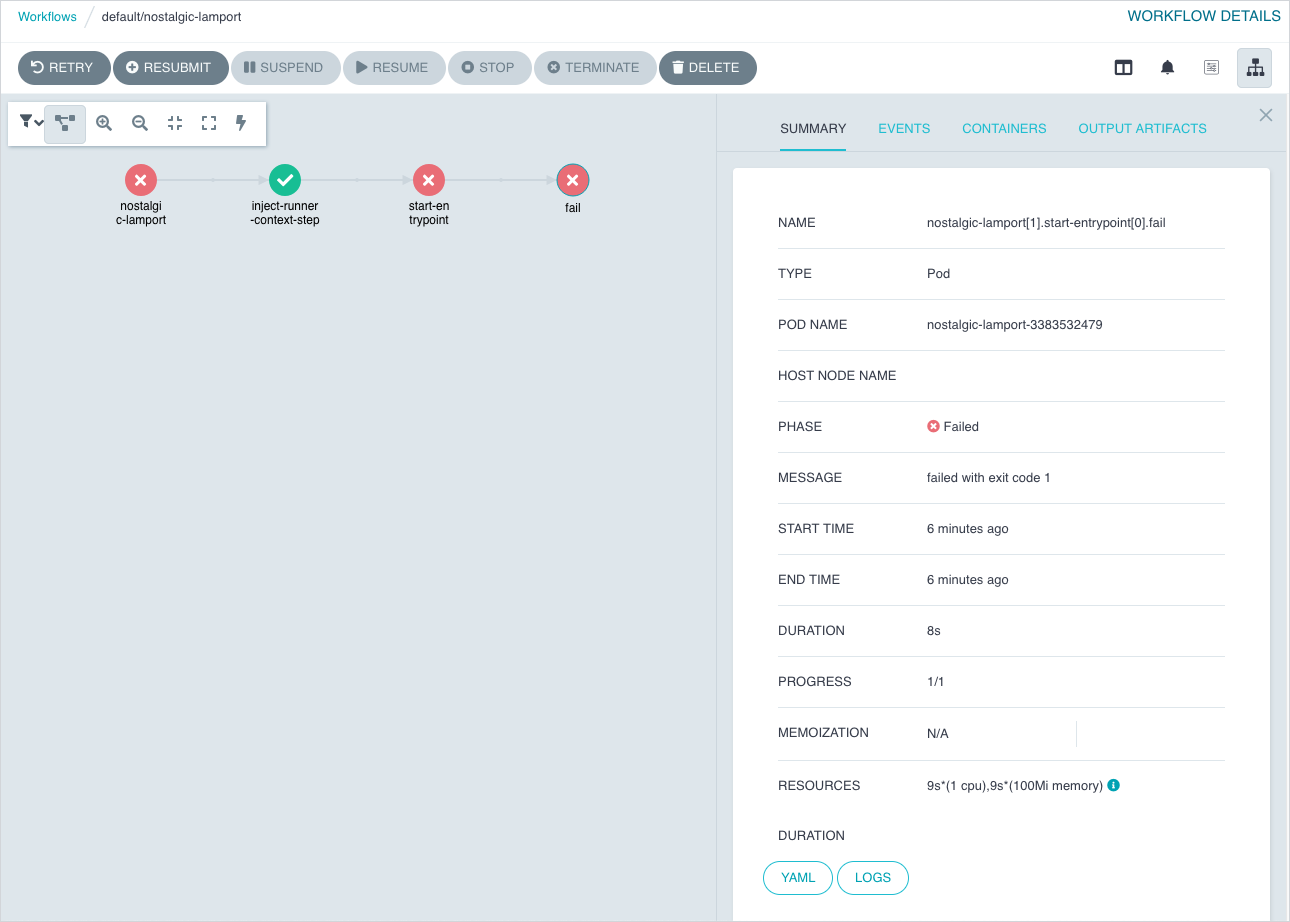
argo get {ACTION_NAME} -n {ACTION_NAMESPACE}Using browser.
By default, the Argo UI is not exposed publicly. You need to port-forward the Service to your local machine:
kubectl -n capact-system port-forward svc/argo-server 2746Navigate to http://localhost:2746 to open Argo UI. Argo Workflow has the same name as the executed Action.
Checking cluster Policy#
To check the cluster Policy definition, run:
kubectl get cm -n capact-system capact-engine-cluster-policy -oyamlGateway#
This section describes Gateway related diagnostic.
Gateway health#
To check if the Gateway Pods are in the Running state, run:
kubectl get po -n capact-system -l app.kubernetes.io/name=gatewayAll the containers from Pods should be in the Running status. Restarts number higher than 1 may also indicate problems, e.g. not enough resource, lack of permissions, network timeouts etc.
Gateway logs#
If the Gateway is healthy, you should be able to track any bug by checking the logs. To check the logs, run:
kubectl logs -n capact-system -l app.kubernetes.io/name=gateway -c gatewayTo check the logs since a given time, use the --since-time flag, for example:
--since-time=2020-03-30T10:02:08ZPublic Hub#
This section describes Public Hub related diagnostic.
Public Hub health#
To check if the Public Hub Pods are in the Running state, run:
kubectl get po -n capact-system -l app.kubernetes.io/name=hub-publicAll the containers from Pods should be in the Running status. Restarts number higher than 1 may also indicate problems, e.g. not enough resource, lack of permissions, network timeouts etc.
Public Hub logs#
If the Public Hub is healthy, you should be able to track any bug by checking the logs. To check the logs, run:
kubectl logs -n capact-system -l app.kubernetes.io/name=hub-public -c hub-publicTo check the logs since a given time, use the --since-time flag, for example:
--since-time=2020-03-30T10:02:08ZHub Populator logs#
If the Public Hub is healthy, you should be able to track any bug by checking the logs. To check the logs, run:
kubectl logs -n capact-system -l app.kubernetes.io/name=hub-public -c hub-public-populatorTo check the logs since a given time, use the --since-time flag, for example:
--since-time=2020-03-30T10:02:08ZChecking if Public Hub is populated#
Check if Hub Populator logs contain a message similar to:
{"level":"info","ts":1620895282.3582015,"caller":"register/ocf_manifests.go:107","msg":"Populated new data","duration (seconds)":235.525841306}. It means that manifests were populated successfully. If you get an error similar to:error: container hub-public-populator is not valid for pod capact-hub-public-84cc74bc66-pmkhpit means that the Public Hub Populator is disabled. To enable it, run:helm repo add capactio https://storage.googleapis.com/capactio-stable-chartshelm upgrade capact capactio/capact -n capact-system --reuse-values --set hub-public.populator.enabled=trueCheck if manifests can be fetched from the Public Hub. Install the latest stable Capact CLI, and run:
capact hub interfaces searchSuccessful response, should look similar to:
PATH LATEST REVISION IMPLEMENTATIONS+---------------------------------------------------------+-----------------+-----------------------------------------------------------------+ cap.interface.analytics.elasticsearch.install 0.1.0 cap.implementation.elastic.elasticsearch.install cap.implementation.aws.elasticsearch.provision+---------------------------------------------------------+-----------------+-----------------------------------------------------------------+ cap.interface.automation.concourse.change-db-password 0.1.0 cap.implementation.concourse.concourse.change-db-password+---------------------------------------------------------+-----------------+-----------------------------------------------------------------+...Check if manifest source is correct, run:
kubectl -n capact-system get deploy capact-hub-public -o=jsonpath='{$.spec.template.spec.containers[?(@.name=="hub-public-populator")].env[?(@.name=="MANIFESTS_PATH")].value}'Check the go-getter project to understand URL format.
Local Hub#
This section describes Local Hub related diagnostic.
Local Hub health#
To check if the Local Hub Pods are in the Running state, run:
kubectl get po -n capact-system -l app.kubernetes.io/name=hub-localAll the containers from Pods should be in the Running status. Restarts number higher than 1 may also indicate problems, e.g. not enough resource, lack of permissions, network timeouts etc.
Local Hub logs#
If the Local Hub is healthy, you should be able to track any bug by checking the logs. To check the logs, run:
kubectl logs -n capact-system -l app.kubernetes.io/name=hub-local -c hub-localTo check the logs since a given time, use the --since-time flag, for example:
--since-time=2020-03-30T10:02:08ZChecking if TypeInstance exists#
To check if TypeInstance exists. Install the latest stable Capact CLI, and run:
capact typeinstance get {TYPE_INSTANCE_ID}Successful response, should look similar to:
TYPE INSTANCE ID TYPE USES USED BY REVISION+--------------------------------------+---------------------------------+---------------------------------------+--------------------------------------+----------+ d9975239-6483-444b-b7de-b9f5a47a710d cap.type.helm.chart.release —— —— 1+--------------------------------------+---------------------------------+---------------------------------------+--------------------------------------+----------+Pod restart#
When Pods are unhealthy, or if the operation processing is stuck, you can restart the Pod using this command:
kubectl delete po -n capact-system -l app.kubernetes.io/name={COMPONENT_NAME}